Single Crystal Applications
The transmission, reflection and absorption of infrared light through single crystals can be simulated using PDielec and PDGui. Incoherence of all dielectric layers is modelled by considering the the transmission matrix for the intensity of light rather than the amplitude or by averaging the propagation phase of the internally reflected light.
Single Crystal Study of Thickness Effects in MgO
This example looks at an isotropic system. The results of a CASTEP calculation of MgO have provided the frequency-dependent permittivity and this is used to look at the effect of crystal thickness on the reflectance, transmittance and absorptance. The examples shown here were calculated using the scripts mgo_coherent_size_effects.py in the Examples/SingleCrystal/MgO directory of the GitHub distribution. A 45o incident beam on the (001) surface of MgO is used to calculate the transmittance, reflectance and absorbtance of thin films with thickness of 0.1, 1, 10 and 100 microns. The results of the coherent calculations are shown in Fig. 40

Fig. 40 Effects of Film Thickness of MgO in Coherent Light, a 45o incident beam with p- polarisation
The results for the ‘thick slab’ case are shown only for reflectance and absorbtance. It can be seen that the reflection in the restrahlen region between the TO and LO frequencies (388 and 693 \(cm^{-1}\)) is almost total with also very little absorbtance. The ‘thick slab’ designation refers to a situation where the dielectric material is used as the substrate. As such there is no internal reflection and no transmittance. The 0.1μm thickness shows peaks in reflectance and corresponding drops in transmittance at both the TO and LO frequencies, whilst showing only absorbtance at the TO frequency. The 1μm thickness shows considerable broadening of these signals, with the TO reflectance splitting into a doublet. At 10μm, below the TO frequency there are oscillations in the reflectance, transmittance and absorptance which are a result of interference between the internally reflected waves. They occur because the light is coherent. The oscillations continue until they meet the ‘thick slab’ limit and they then follow this limit until frequencies above the LO frequency. At 100μm, the oscillations below the TO frequency are very fast and they reach the ‘thick slab’ limiting case at lower frequencies than for the 10μm case. Similarly at higher frequencies they follow the ‘thick slab’ limiting case.
The effect of thickness on the “Incoherent (intensity)” method is shown in Fig. 41. This method uses intensities rather than amplitudes for the transfer matrix and as a result, all the phase information is lost, resulting in no interferences after internal reflections. The calculations shown are for p- polarised incident radiation.
The incoherent method deviates from the ‘thick slab’ results at very low frequencies, but as the film thickness increases the deviations become smaller. Similarly at frequencies above the LO frequency, the deviations from the ‘thick slab’ results are less for the thicker films. The user needs to be aware that for large thicknesses the calculation of the propagation matrix can lead to numerical overflows. These manifest themselves as sudden changes in reflectance or transmittance. In such cases it is recommended to use the ‘Incoherent (non-reflective)’ method or use the scattering matrix method with Incoherent (phase averaging).

Fig. 41 Incoherent (intensity) mode - a 45o incident beam with p- polarisation
Komandin et al [75] have reported terahertz spectra of 0.5μm thick MgO crystals which are dominated by interference at low frequencies. In Fig. 42 a digitised spectrum obtained from this publication is compared with calculations. Considering only calculated information (refractive index, LO and TO frequencies, etc.) is being used, it can be seen that, despite the rather poor digitisation, the agreement is very good. Agreement with the number of interference bands and the amplitude of the bands is also good.

Fig. 42 Comparison of calculated and experimental transmittance terahertz spectra
Finally, we compare a digitised spectrum of the reflectance measured over the range 0 - 800 \(cm^{-1}\) with the spectrum calculated using PDGui and Castep. The ‘thick slab’ approximation has been used as no oscillations are detected in the low-frequency experimental results. The calculated and experimental results are in excellent agreement. The shoulder on the experimental result is due to two phonon processes that are not considered in the present theoretical work.

Fig. 43 Comparison of calculated and experimental reflectance infrared spectra
Single Crystal Study of Forsterite
In a publication on the interpretation of the experimental spectrum of forsterite [76] a Four Parameters Semi-Quantum (FPSQ) model for the single crystal infrared spectrum of this material was presented. In this application note that we use the experimental file format of PDielec to define the FPSQ model parameters from the paper and use it to calculate the reflectance spectrum for comparison with that published in the paper. The FPSQ model is defined by the following equation.
Forsterite is an orthosilicate belonging to an orthorhombic space group. The permittivity matrix is diagonal when the x, y and z axes of the crystal are aligned with a, b and c axes of the unit cell. The parameters for the FPSQ model are summarised in the tables below.
X |
Y |
Z |
|
X |
2.83 |
0.0 |
0.0 |
Y |
0.0 |
2.69 |
0.0 |
Z |
0.0 |
0.0 |
2.76 |
EPS(xx) |
EPS(yy) |
EPS(zz) |
|||||||||
|---|---|---|---|---|---|---|---|---|---|---|---|
TO Freq |
TO sigma |
LO Freq |
LO sigma |
TO Freq |
TO sigma |
LO Freq |
LO sigma |
TO Freq |
TO sigma |
LO Freq |
LO sigma |
202.6 |
0.18 |
202.9 |
0.28 |
144.9 |
0.09 |
145.5 |
0.21 |
278.3 |
0.50 |
278.9 |
0.54 |
276.6 |
0.59 |
277.1 |
0.84 |
278.6 |
0.68 |
278.9 |
0.79 |
292.7 |
0.90 |
305.6 |
0.36 |
296.1 |
0.79 |
300.6 |
1.18 |
290.8 |
1.28 |
311.3 |
0.68 |
306.3 |
0.39 |
316.7 |
0.53 |
321.1 |
0.60 |
322.5 |
0.88 |
351.7 |
2.77 |
376.7 |
1.02 |
411.6 |
2.03 |
414.6 |
1.97 |
383.2 |
1.52 |
390.5 |
1.52 |
397.3 |
2.15 |
412.4 |
2.30 |
418.5 |
3.19 |
456.4 |
1.88 |
405.4 |
1.58 |
468.9 |
2.90 |
419.8 |
2.17 |
444.1 |
2.75 |
425.0 |
4.22 |
424.5 |
3.83 |
476.6 |
4.46 |
478.0 |
3.69 |
458.1 |
4.39 |
489.2 |
2.59 |
478.9 |
3.22 |
487.2 |
3.99 |
504.7 |
3.81 |
532.6 |
5.65 |
507.8 |
2.77 |
513.7 |
4.16 |
506.2 |
2.71 |
580.8 |
8.79 |
532.3 |
5.67 |
552.3 |
9.41 |
529.5 |
4.62 |
575.0 |
8.33 |
874.4 |
4.17 |
996.8 |
4.32 |
606.6 |
4.77 |
651.6 |
12.10 |
838.6 |
6.56 |
844.5 |
7.63 |
||||
840.8 |
6.75 |
841.5 |
7.03 |
872.9 |
5.02 |
965.2 |
3.33 |
||||
959.9 |
2.41 |
965.5 |
3.30 |
986.3 |
4.80 |
994.8 |
2.96 |
||||
978.5 |
3.83 |
1081.1 |
5.76 |
||||||||
The publication presents experimental polarised reflectance infrared spectra of single crystals of forsterite. The incident beam angle to the sample was \(10^{\circ}\). The s-polarised geometry was used and the measurements were made with the electric field parallel to the a-axis, b-axis and c-axis.
In PDGui the laboratory frame is defined by XYZ, with the incident and reflected light in the surface in the XZ plane, with the surface-normal aligned with the Z-axis. The surface is therefore in the XY plane. The azimuthal angle can be used to rotate the crystal about the normal until the crystal axis of interest is parallel to the Y axis of the laboratory frame. With this geometry the s-polarised wave field will be oscillating parallel to the chosen axis. The arrangement described is shown in the Figure below where \(E_s\) and \(E_p\) are the field directions of the incident light.
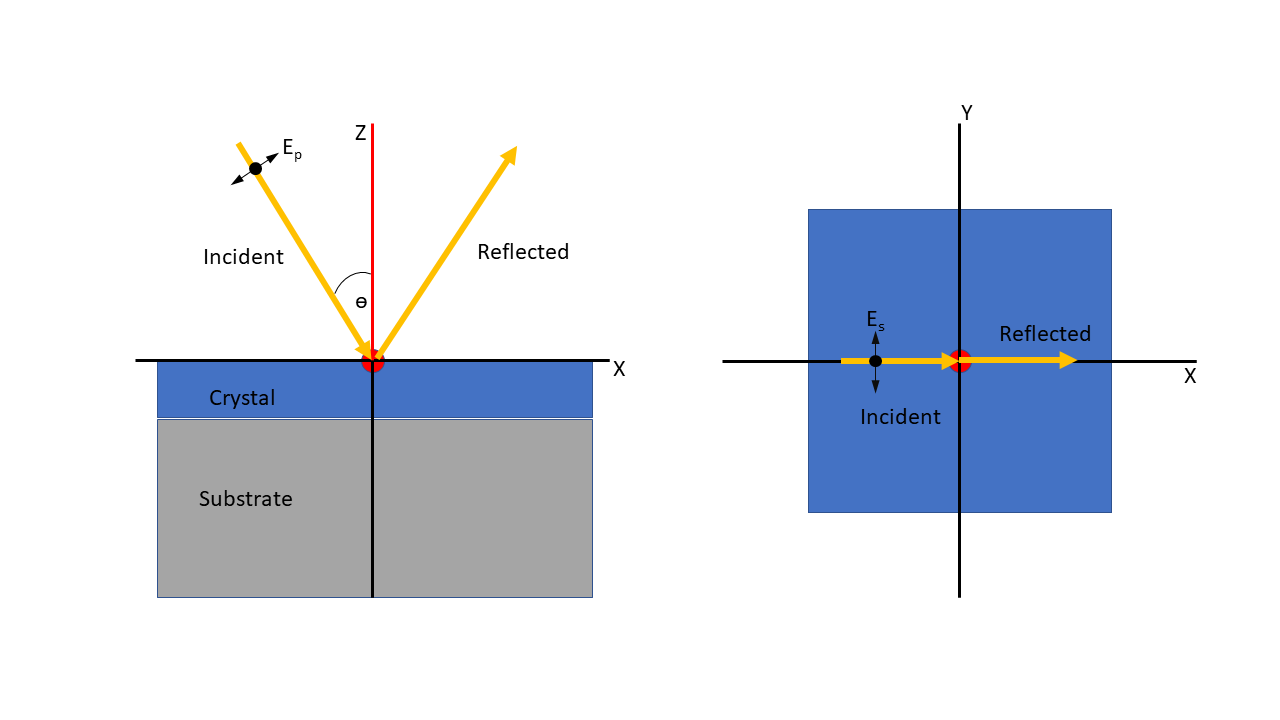
Fig. 44 Definition of the single crystal laboratory coordinates in PDGui
As can be seen \(E_s\) is parallel to the laboratory Y-axis, so it is necessary to line up the crystal unit cell so that the cell direction being investigated is parallel to the Y-axis. In the single crystal scenario tab PDGui shows the crystal axes in terms of the laboratory coordinates so it is relatively straightforward to make sure that the cell direction of interest is aligned along the Y-axis. It is possible to set each axis in one of two ways, depending on the surface being used. For example to make sure the a-axis is aligned with the laboratory Y-axis, we can use either the [001] or the [010] surfaces and simply choose the appropriate azimuthal angle.
The following geometries can be used by PDGui to ensure the relevant axis is aligned with the laboratory Y-axis;
- For the a-axis;
- the [001] surface with azimuthal angle = 90the [010] with azimuthal angle = 90
- For the b-axis
- the [001] surface and azimuthal angle = 0the [100] surface and azimuthal = 90
- for the c-axis
- the [100] surface azimuthal angle = 0the [010] surface azimuthal angle = 0
The two figures below show the reflectance of s-polarised light along the a-axis and these figures show very good agreement with Figure 1 in the published experimental work [76]. The data for this calculation can be found by looking in the Examples section of the installation guide under the Experimental/forsterite example.
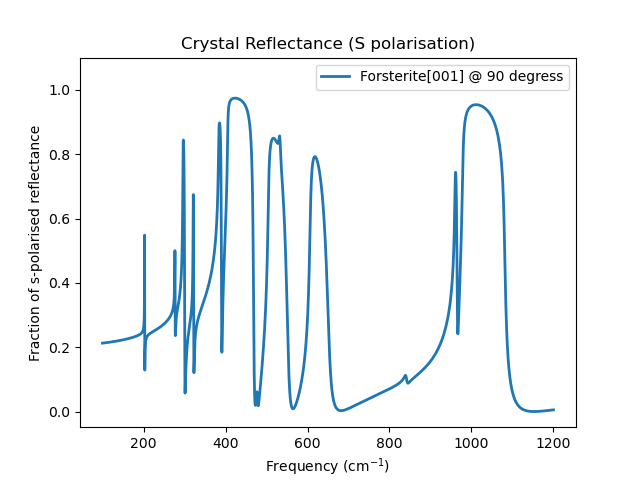

Fig. 45 Forsterite a-axis reflectance (upper figure 100 - 1200 cm-1, lower figure 350 - 600 cm-1)
Single Crystal Study of L-Alanine
In an experimental and computational study of the vibrational modes of single crystals of L-alanine, the experimental transmittance was reported for polarized radiation along each of the principal axes, a-, b- and c-. [77]
The directory Examples/SingleCrystal/L-alanine contains files for the calculation of the transmittance and reflectance of single crystals of L-alanine based on similar calculations to those reported in the paper, using Crystal17 to perform the DFT calculations, and using PDGui to calculate the transmittance and reflectance properties of the crystal. Details of the DFT calculation using the B97-3c functional can be found in phonon.dl2. The output can be found in phonon.out. Other files produced by the Crystal17 calculation are BORN.DAT and HESSFREQ.DAT. These are used by PDGui to calculate the theoretical spectrum.
The experimental results for the measurement of terahertz transmittance were kindly provided by the authors of the experimental paper: J. L. Allen, T. J. Sanders, J. Horvat, R. A. Lewis and K. C. Rule [77]. We would like to thank the authors of the paper for providing the experimental data and for helpful discussions. Their measurements can be found in the spreadsheets a-axis-experimental.xlsx, b-axis-experimental.xlsx and c-axis-experimental.xlsx. Each of these spreadsheets has two columns, the first is a column of frequencies in cm-1 and the second is the transmittance.
Scripts used to generate the crystal transmittance for the electric field along the respective crystal axes from the calculated phonon modes can be found in a-axis.py, b-axis.py and c-axis.py. These scripts use the Fitter Tab to compare the calculated spectrum with the experimental one. Changes have been made to the film thickness and to the widths of the peaks to improve the agreement between the two.
To run the scripts use a command such as,:
pdgui -script a-axis.py
In the following, the steps used to get to the scripts are explained. We will concentrate on the a-axis spectrum but the approach is similar for each axis considered.
L-alanine crystallises in an orthorhombic form, with 3 non-equivalent axes. To initialise PDGui with the results of the DFT calculation and starting the GUI interface with the Scenario tab in its single crystal mode use the command below,:
pdgui phonon.out -scenario crystal
The Main Tab shows the calculated unit cell and the frequencies as calculated by Crystal17.
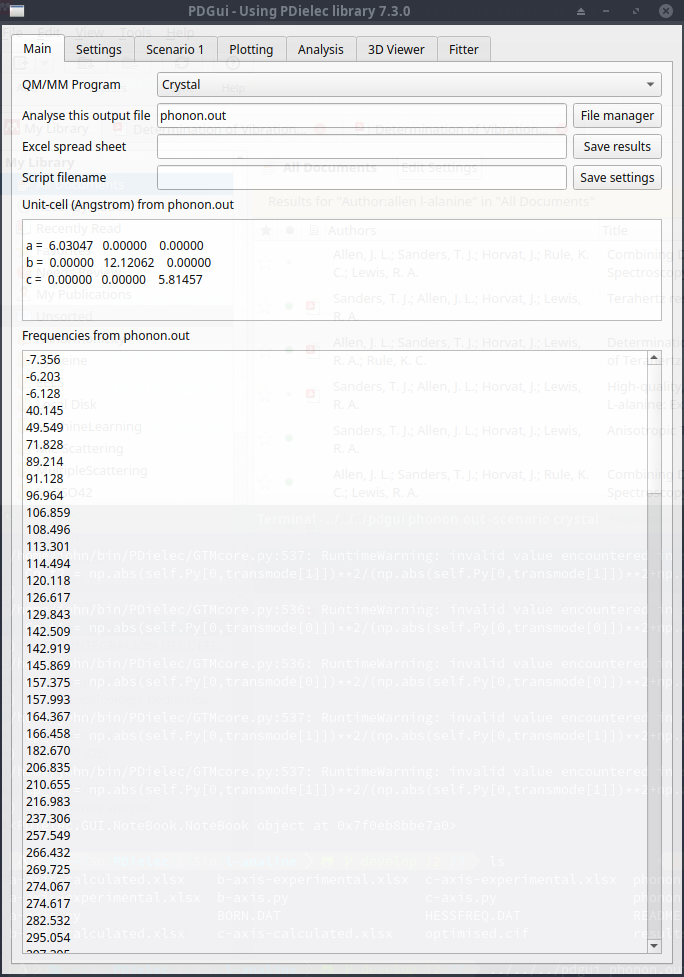
Fig. 46 L-alanine Main Tab
The Settings Tab (see below) shows those settings which affect the calculation of the permittivity. By default, the frequencies are modified by projecting out any translational degrees of freedom. This is shown by the three zero frequencies in the table of frequencies and is a result of selecting Apply Eckart conditions? The atomic masses are selected by PDGui and maybe different to those used by the DFT calculation. A Lorentzian line width is applied to all phonon vibrations by default. In this case, we have chosen a large value by default and applied smaller and more realistic values for those phonon modes important to transmission for the a-polarised electric field.
The contribution to the permittivity arising from electronic polarisation is shown in this Tab. In the case of Crystal17 and the B9703c functional the CPHF calculations is not possible because the exchange/correlation functional is not supported and the \(\epsilon_{\infty}\) calculation is not performed and a zero matrix will be presented here. In this example, we have typed in the contribution from a Crystal17 calculation using PBE-D3. The resulting spectrum is not very sensitive to these settings.

Fig. 47 L-alanine Settings Tab
The next tab is the Scenario tab which is used to reflect the experimental parameters that are possible. In this case, we are looking at the single crystal scenario. The mode of operation in the example shown below is the Coherent mode. In this case, the surface that the THz beam is incident on is the (001) surface, so the c-axis will be pointing along the Z-axis of the laboratory coordinate frame. The permittivity of the superstrate and substrate is set to 1.0, consistent with the experimental conditions. The geometry of the incident beam relative to the crystal is controlled by the azimuthal angle. A zero value for the incident angle means the beam is at 90o to the surface. A non-zero angle defines the laboratory coordinates as the beam lies in the XZ plane. For this example, the incident beam angle will be set to 0o. Once this is done information about the position of the crystal axes relative to the crystal frame can be seen in the text box of the Settings tab. Changes to the azimuthal angle will result in alterations to the definitions of the crystal axes in terms of the laboratory coordinates. We are interested in radiation polarised with the electric field active along the a-axis of the crystal, which, according to the Lab frame information lies along the Y-axis of the laboratory coordinate. This corresponds to s-polarised light, so we will be looking at the s-component of the transmittance.
An important parameter to consider is the thickness of the film and the method by which we will calculate the transmission and reflectivity. To start with we will use the Coherent mode and a thickness of 0.2mm. Experimentally [77], the crystal thickness was measured to be 0.5±0.1mm, but with this thickness the calculation showed little transmission in the chosen frequency range.
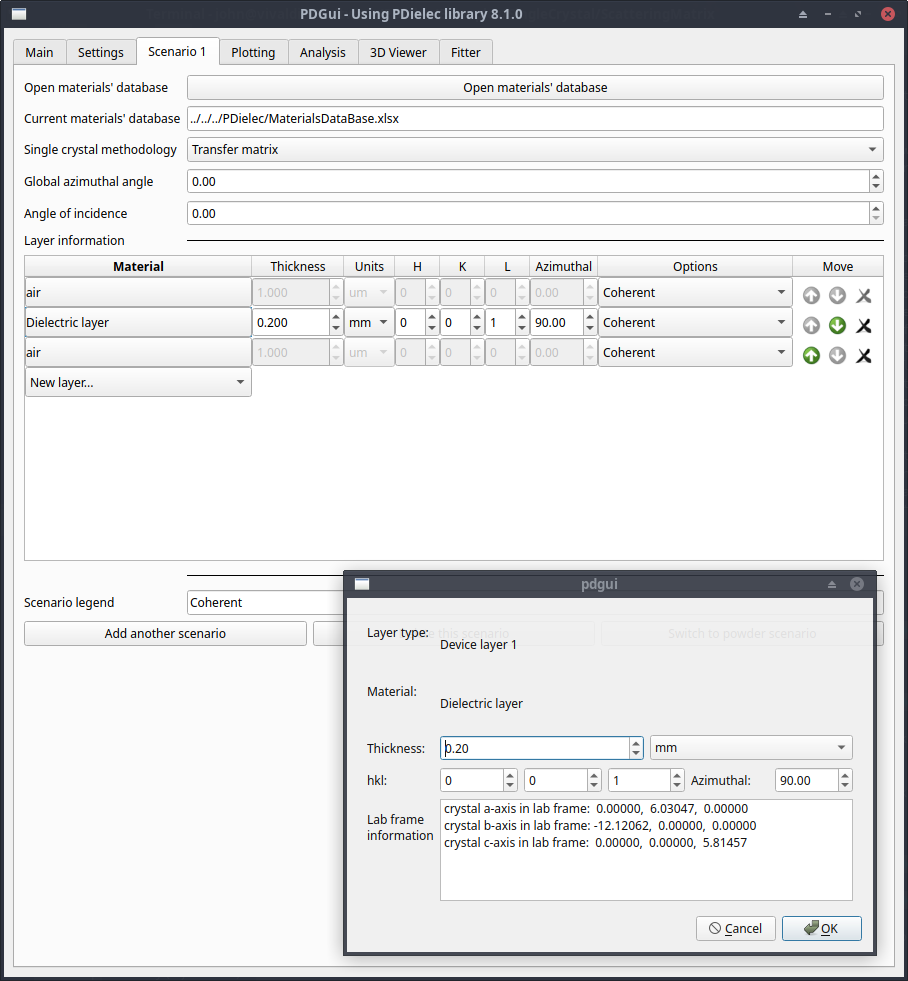
Fig. 48 L-alanine Scenario Tab
The resulting spectrum is shown below. It can be seen that there are regular oscillations in the transmittance, especially at low frequencies. These are due to interference of the directly transmitted light and light that has undergone internal reflection and generated a series of decaying etalons.
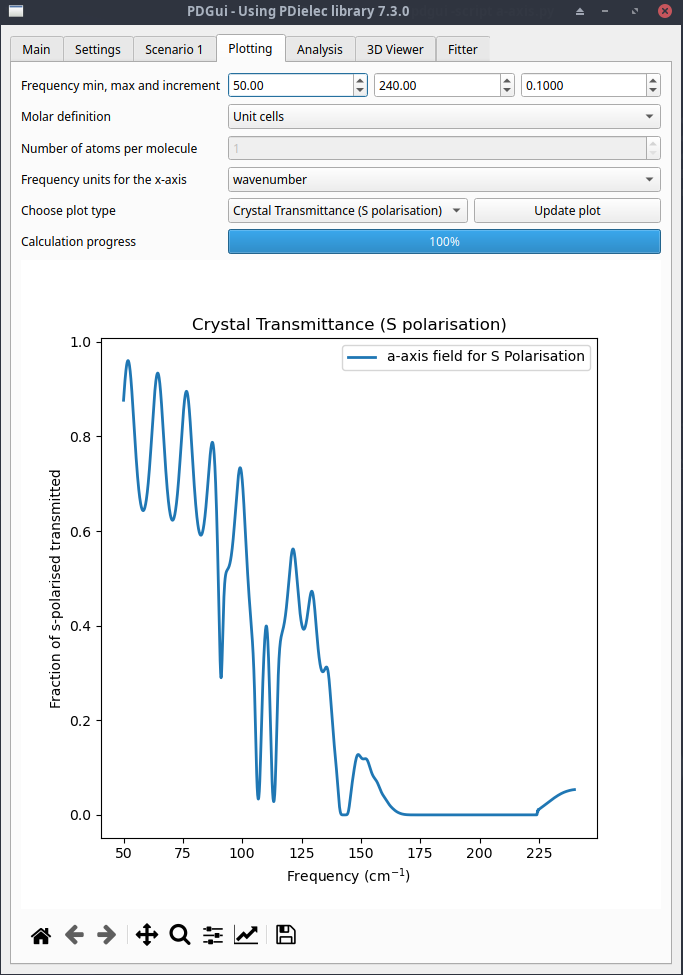
Fig. 49 L-alanine Plotter Tab showing coherent light transmittance
To see if we can remove this we will change the option for this layer in the Scenario tab to Incoherent (intensity). Re-plotting the spectrum and looking at the results in the Fitter tab is shown in the plot below. The calculated spectrum is compared directly with the experimental one. Both the calculated and experimental spectra show little transmittance above about 140cm-1. The strong, very sharp peaks at 225cm-1 and above are probably numerical problems that occur with thicker films when transmission tends to zero. These numerical problems are exacerbated by the Incoherent (intensity) method as it uses intensities in the calculation of the transfer matrix, which requires the square of the electric field and the propagation matrices. The fact that these are numerical problems can be verified by looking at the Coherent method and seeing if they are present there. Even if the experimental measurements are designed to minimise etalons, it is generally sensible to compare both incoherent and coherent calculations before comparing with experiment.
A major advantage of using the Fitter tab to understand the calculated spectrum is that the user can modify the Lorentzian widths and see the result immediately, while also comparing them with the experimental spectrum. This also shows the cross-correlation between experiment and calculation, for this example the value is 0.9379 (where 1 is a perfect match).

Fig. 50 L-alanine Plotter Tab showing incoherent light transmittance for a-axis polarised light
Plots for the b-axis and c-axis electric fields are shown below. The b-axis example is given by using the same (001) surface but using an azimuthal angle of 0o. The thickness used for the b-axis example is 0.1mm, smaller than the 0.2mm used for the a-axis example. The c-axis field transmittance example uses the (010) surface with an azimuthal angle of 0o and a thickness of 0.1mm.
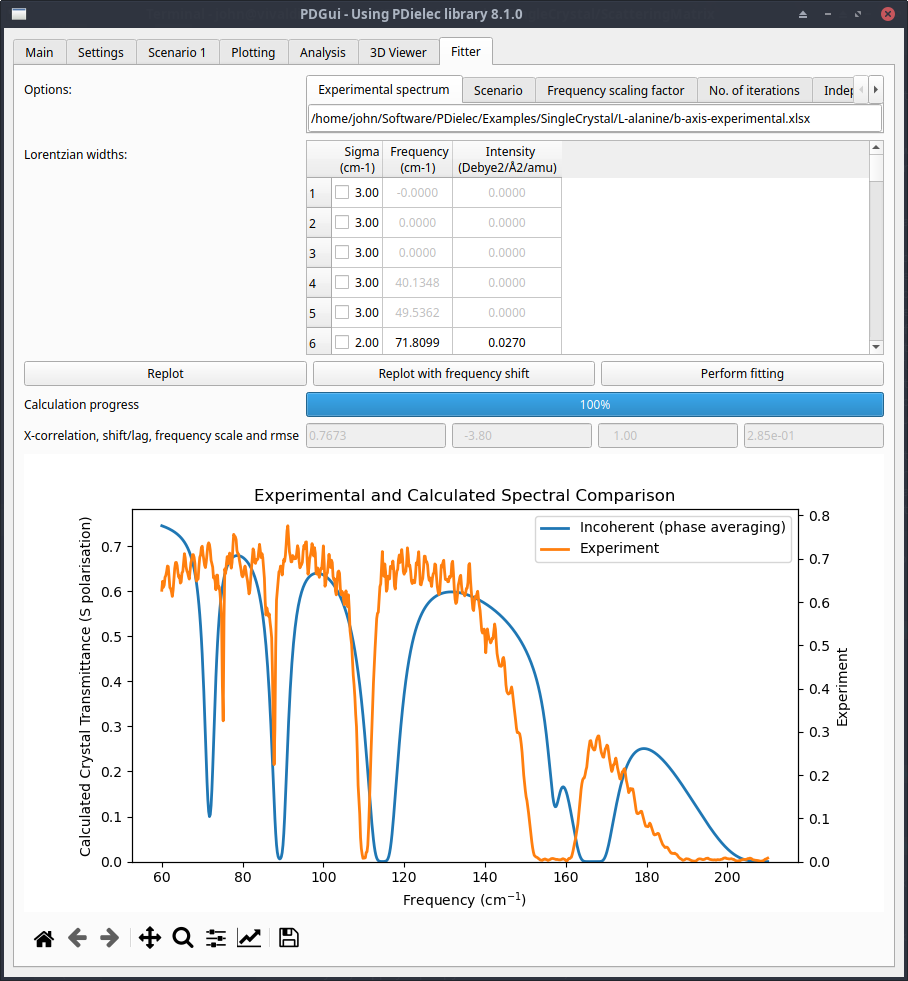
Fig. 51 L-alanine Plotter Tab showing incoherent light transmittance for b-axis polarised light

Fig. 52 L-alanine Plotter Tab showing incoherent light transmittance for c-axis polarised light
AlN on Silicon and Silicon Carbide
This is an example of a multilayer system where two layers are anisotropic. In an experimental and theoretical study of the infrared reflectance of aluminium nitride on silicon and silicon carbide, MacMillan, Devaty and Choyke [78] used a four parameter semi-quantum (FPSQ) model to describe their experimental results on aluminium nitride on various substrates. In the Examples/Experimental/AlN directory the file AlN.exp provides an experimental file that describes their FPSQ model in a format the PDGui can use. In addition, parameters for the permittivities of silicon and 6H-SiC are given in the TestDataBase.xlsx file in the same directory. The 6H-SiC permittivities are provided by a Drude-Lorentz model and the silicon permittivities are calculated from an experimental refractive index. References for the origins of the models and experimental data are given in the spreadsheet.
The first experimental/calculated system considered [78] was the reflectance of a 0.92μ AlN on a Si substrate. This was modelled using PDGui after reading in the experimental file, AlN.exp, the Single Crystal Scenario Tab was used to define the system as described in the paper. The superstrate material was chosen as air, an AlN dielectric film of 0.92μ was specified on top of a 1.0μm film of silicon, and an angle of incidence of 7.2 o was used. The (001) surface of AlN was defined, so the perpendicular to the surface aligns with the laboratory Z-axis. The bottom layer is treated as a semi-infinite layer, so the size of the silicon layer specified in the GUI is irrelevant. The scenario is shown below:
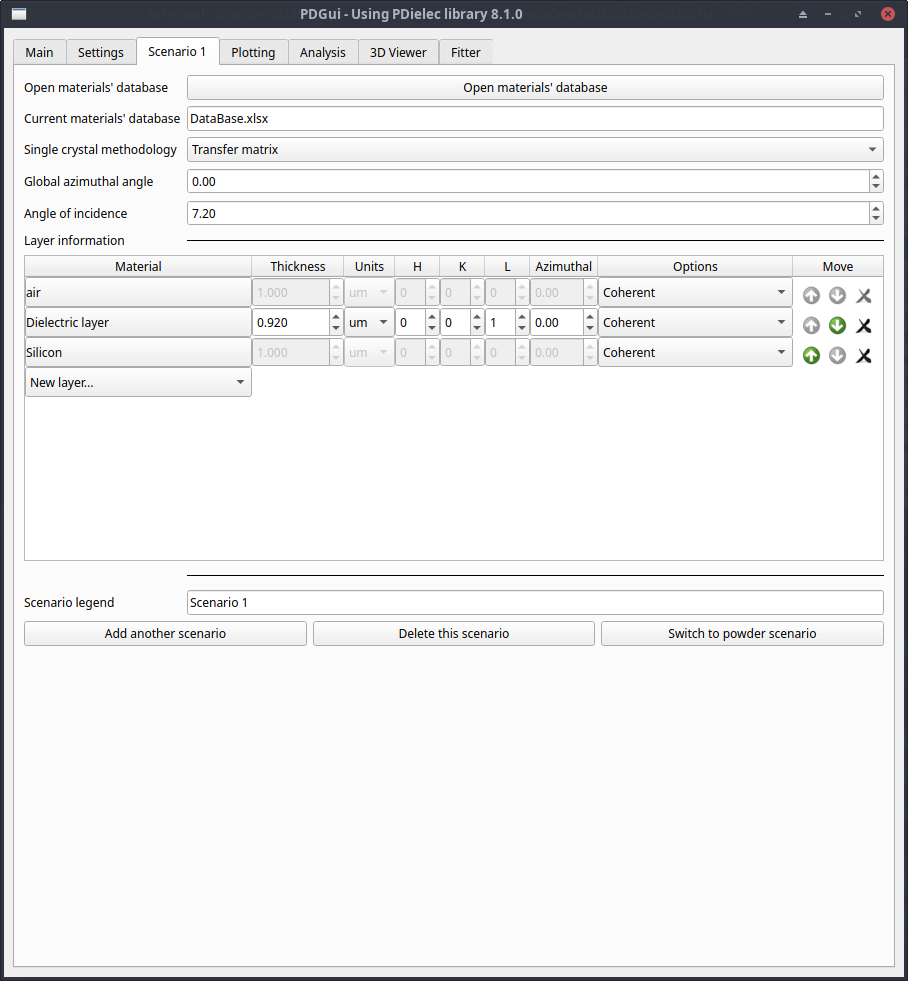
Fig. 53 AlN on Silicon Scenario Tab
Two comparisons are made with the calculated results of the published paper after digitising Figures 1 and 2 of the paper. In the first, the range of the plot extends for 0 to 6000 cm-1 and clearly shows the etalons associated with the interference. In the second the plot examines the region between 400 and 1200 cm-1. The agreement is excellent.

Fig. 54 AlN on Silicon reflectance comparison with experiment

Fig. 55 AlN on Silicon reflectance low frequency comparison with experiment
Figure 3 of the paper shows the reflectance of a 0.98μm film of AlN on the (0001) surface of 6H_SiC. To model this with PDGui two layers have been created, one for the dielectric layer, which has been created from an experimental file, and one for SiC, which has been taken from MaterialsDatabase.xlsx. The layer editor has been used to show that both layers are (001) surfaces with the c-axis of the crystals pointing along the Z-laboratory axis. The top layer (the superstrate) is air below which is the Dielectric layer (AlN in this case).
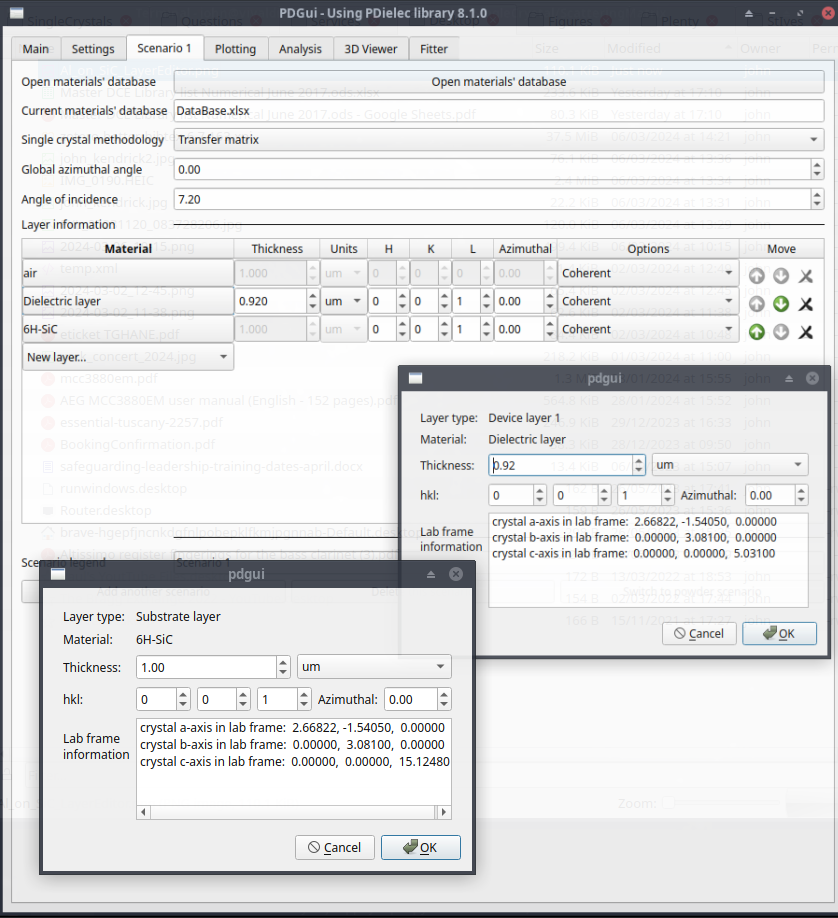
Fig. 56 AlN on SiC Scenario Tab
A comparison is given below between the calculated spectrum reported in the paper and that produced by PDGui.

Fig. 57 AlN on SiC reflectance compared with experiment
A final comparison is made between Figure 4 of the paper and the results of PDGui. In this case, a 0.24μm film of SiC is supported on a 0.56μm film of AlN, which is deposited on a substrate of Silicon. For this example, the Coherent mode is used. The ScenarioTab for this system is shown below.

Fig. 58 SiC on AlN on Silicon Scenario Tab
A comparison is given below between the calculated spectrum reported in the paper and that produced by PDGui.

Fig. 59 SiC on AlN on Silicon reflectance comparison with experiment
Sapphire Orientation Dependence of Polarized Infrared Light
Sapphire and ruby are \(\alpha\) Al 2 O 3, which belongs to an hexagonal crystal system. Due to the complexity of vibrations in the infrared red region and to the anisotropy of the permittivity, the polarized IR reflectance is sensitive to the crystal plane and to its orientation. Lee et. al. [79] measured the infrared reflectance response of sapphire and fitted an FPSQ model to the experimental observations. As confirmation of the correct behaviour of PDGui for the generation of crystal surfaces and for the calculation of reflectance, the FPSQ model proposed by Lee et. al. has been incorporated into the materials’ database of PDGui and the calculations reported in their paper have been reproduced. To achieve this, a simple experiment file for air has been used as the dielectric medium. Files with the information necessary to reproduce the results presented here are available on the PDielec GitHub in the Examples/Experiment/Sapphire directory.
The paper of Lee et. al. [79] gives very clear descriptions of the c-plane, a-planes and r-planes of sapphire. This note will describe in detail how the planes have been established in PDGui. The c-plane is easy to set up. For hexagonal crystals the Miller-Bravais index is (hkil) which represents a plane that interects the 4 axes of hexagonal crystal coordinate system. By definition the third integer, i, is equal to -(h+k) and is therefore redundant but useful in elucidating the families of faces which are equivalent. For the c-plane the only other related surface to (0001) would be (000-1) and the Miller indices for these surfaces would be (001) and (00-1).
The figure shows the settings in the Single Crystal Scenario Tab. The DataBase.xlsx file is being used as the materials database and the last layer in the list of layers (Silicon) will be treated as a semi-infinite material. The Angle of incidence is set to 7.2 o as specified in the paper. The ‘dielectric’ film in this case is air, which has a constant unit permittivity, its thickness is arbitrary. The second layer is a 1.0μm film of sapphire taken from the database with (hkl) set to (001). The layer was added using the Layer Editor.
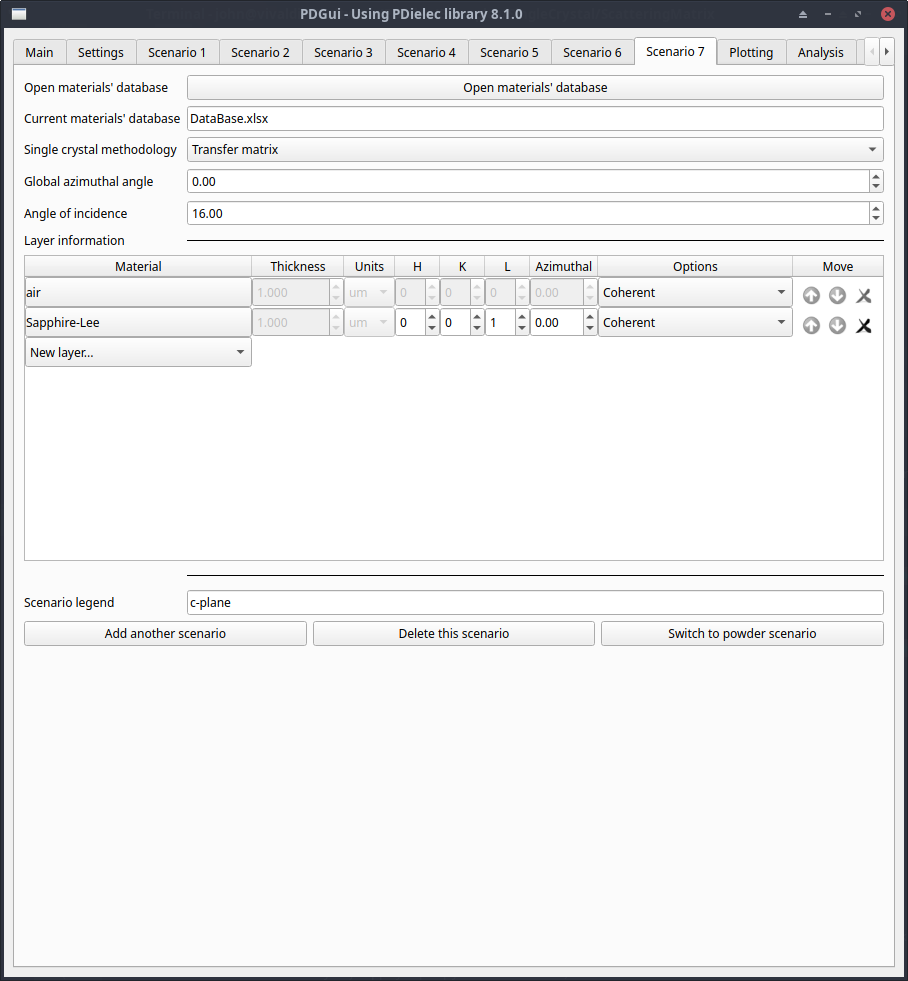
Fig. 60 Sapphire scenario tab
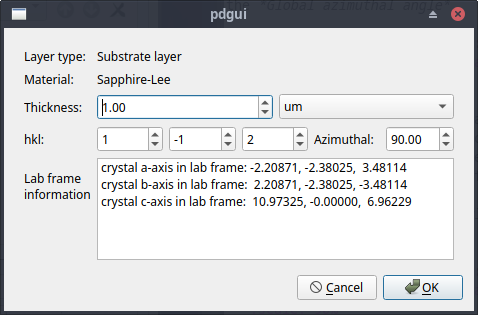
The a-plane family of surfaces are described by (11-20) and its permutations: (1-210), (-2110) (-1-120), (-12-10) and (2-1-10). This is equivalent to the Miller notation (110), (1-20), (-210), (-1-10), (-120) and (2-10). The paper used the (11-20) plane but in this work, the equivalent (-2110) is used with an azimuthal angle set for the layer of 90 o. The Layer Editor for this is shown below, where it can be seen that the c-axis of the crystal lies along the X-laboratory axis and the a-axis of the crystal lies parallel with the Z-laboratory axis, as described in Figure 1 of the paper. Once the correct orientation has been chosen the azimuthal angle of the complete system can be changed by altering the Global azimuthal angle.

Fig. 61 Sapphire layer editor
The r-plane family of surfaces are described by (1-102), (10-12), (01-12), (-110-2), (-101-2) and (0-11-2). The equivalent Miller index descriptions are (1-12), (102), (012), (-11-2), (-10-2) and (0-1-2). In this case, the (1-12) surface was used with a layer azimuthal angle of 90 o. The Layer editor for this surface is shown below which shows the c-axis of the crystal lying in the XZ plane of the laboratory coordinate system as described in the paper. Again the Global azimuthal angle can be used to rotate the whole system relative to the laboratory Z-axis.
The results are shown below and can be compared with Figures, 4, 5 and 6 of the paper.

Fig. 62 c-plane reflectance

Fig. 63 a-plane reflectance

Fig. 64 r-plane reflectance