Applications of Effective Medium Theory
Several examples are given to illustrate some applications of the package to the absorption of light in powdered dielectric materials. The calculations used to provide the data for the permittivities are sufficiently accurate to illustrate aspects of the theory. The examples are chosen to show the package being used with the QM packages CASTEP and VASP and with the MM package GULP. The data used to generate the figures shown below are available in the Examples/ directory. The application_note.py file is a script that will generate and perform the calculations used in each application note and the application_note.xslx file is a spreadsheet containing the calculated data.
MgO using CASTEP
Magnesium oxide is an isotropic medium, the initial unit cell and the space group symmetry (\(Fm\overline{3}m\)) were taken from the Inorganic Crystal Structure Database (ICSD) [57] reference number ICSD-52026 [58]. The primitive cell was optimised using CASTEP. Norm-conserving pseudo-potentials were used to represent the core electrons of magnesium and oxygen. An energy cutoff of 1000 eV was used with the PBE [59] density functional and a k-point spacing for the Monkhorst-Pack grid of 0.04 Å-1. The primitive cell was optimised and a Density Functional Perturbation Theory (DFPT) calculation of the phonon spectrum at the gamma point was performed. The optimised lattice parameter was found to be 2.1234 Å, compared with the experimental value of 2.107 Å. Only 3 degenerate modes contribute to the permittivity. A summary of the results is presented in Table 9.
Property |
Experimental |
Calculated |
|---|---|---|
Unit cell dimensions (Å): |
2.107 |
2.1234 |
Space group: |
\(Fm\bar{3}m\) |
|
Optical permittivity: |
3.1400 |
|
Static permittivity: |
10.000 |
|
TO phonons |
Frequency (cm-1) |
Intensity (D2Å-2amu-1) |
T: |
388.3 |
9.29 |
LO phonons |
||
T (001): |
693.7 |
Because MgO is isotropic with only a single frequency contributing to the permittivity, it makes a useful example application to illustrate several features of PDielec. The real and imaginary frequency-dependent permittivities of the perfect crystal are shown in Fig. 18, where a damping factor (\(\sigma\)) of 10 cm-1 has been used. The Figure shows one component of the diagonal, isotropic matrix. In the Figure the real permittivity at zero frequency corresponds to the static permittivity in Table 9, and at frequencies above the absorption at 388 cm-1 the permittivity tends to the optical permittivity as the frequency increases. The real permittivity has zero values at 388.3 and 693.7 cm-1 which are the TO and LO frequencies respectively. The data for this calculation can be found by looking in the Examples section of the installation guide under the Castep/MgO example.

Fig. 18 Permittivity of MgO

Fig. 19 Real and imaginary permittivities of a 1% volume fraction of MgO spheres in PTFE using the Maxwell-Garnett method
Using the Maxwell-Garnett mixing rule, Fig. 19 shows the calculated permittivities of a 1% volume fraction of MgO spheres in a supporting medium with a frequency-independent permittivity of 2.0, which would be typical of a material such as PTFE. Due to the dilution effect, the real component has shifted to a base-line value close to 2, and the absorption, as indicated by the maximum in the imaginary component has shifted by about 150 cm-1 to 550 cm-1.
The effect of volume fraction on the predicted molar absorption coefficient, using the Maxwell-Garnett mixing rule, is shown in Fig. 20. The lowest volume fraction of MgO gives the largest shift of the absorption peak to high frequency. As the volume fraction increases the mixing rule predicts a broadening of the absorption, whilst the peak in the molar absorption coefficient moves to lower frequency. At the highest loading (f=0.9) the maximum absorption occurs quite close to the TO frequency. The Maxwell-Garnett mixing rule is regarded as being appropriate for low-volume fractions and so should not be used for interpreting results in which higher-volume fractions of absorbing media have been used [34]. The data for this calculation can be found by looking in the Examples section of the installation guide under the Castep/MgO/application_note_mg example.

Fig. 20 Effect of volume fraction on the Maxwell-Garnett molar absorption coefficient of MgO spheres in PTFE
Fig. 21 shows the same plot for the Bruggeman mixing rule. At low volume fractions the Bruggeman mixing rule predicts a similar absorption to the Maxwell-Garnett. Indeed as the volume fraction approaches zero the two rules predict the same absorption characteristics. However, even at the relatively low 1% loading, the Bruggeman mixing rule shows an additional broadening of the peak; the shape of the absorption peak has lost its Lorentzian characteristic shape as can be seen clearly in Fig. 21. At 10% loading the Bruggeman predicted absorption is broad with the peak shifted to lower wavenumber. This broadening increases with increased loading until, at the higher loadings, the TO peak begins to dominate the absorption. The data for this calculation can be found by looking in the Examples section of the installation guide under the Castep/MgO/application_note_bruggeman example.

Fig. 21 Effect of volume fraction on the Bruggeman molar absorption coefficient of MgO spheres in PTFE

Fig. 22 The Maxwell-Garnett molar absorption of spherical MgO particles, 1% volume fraction embedded in a media of varying permittivity
Fig. 22 shows the effect of varying the permittivity of the supporting medium. The calculations were performed on spherical MgO particles with a 1% volume fraction. The lowest permittivity is that of a vacuum (or air) and shows the highest shift of the absorption maximum to higher frequencies. Increasing the permittivity lowers the shift until it becomes quite small. A similar effect is seen in the Bruggeman mixing model. However, the absorption resulting from particles in a low dielectric medium is considerably broader than that seen in the Maxwell-Garnet case. This broadening reduces as the permittivity of the medium increases (see Fig. 23). The data for these calculations can be found by looking in the Examples section of the installation guide under the Castep/MgO/application_note_permittivity and application_note_br_permittivity example.

Fig. 23 The Bruggeman molar absorption of spherical MgO particles, 1% volume fraction, embedded in media of varying permittivities
ZnO using VASP
Zinc oxide crystallises in space group \(P6_3mc\) (wurtzite). All calculations were performed by VASP [1] using projector augmented-wave PAW [59] pseudo-potentials, the PBE [60] density functional, an energy cutoff of 600 eV and a k-point resolution of approximately 0.1 Å-1. The initial unit cell was taken from the ICSD [57] with code ICSD-26170 [61]. The unit cell and atom positions were optimised using VASP and the permittivity was calculated using DFPT and the results are reported in Table 10. Only two of the bands showed any significant intensity, a doubly degenerate band (E) with a TO frequency of 372.1 cm-1 and a non-degenerate band (A) with a TO frequency of 350.0 cm-1. The LO frequency of the non-degenerate band is shifted to 502.0 cm-1 for a wave-vector with direction (001), whilst the degenerate modes are unaffected. In the case of the (010) direction, the LO frequency of one of the E modes is shifted to 511.2 cm-1. It is known that ZnO can crystallise with a plate morphology [62] with the (001) surface dominant. Calculations of the molar absorption were performed for a sphere, plate and needle-like shapes with the unique directions of the plate and the needle being normal to the (001) surface. A volume fraction of 1% was chosen for these calculations and the predicted molar absorption coefficients for the Maxwell-Garnett mixing rule are shown in Fig. 24.
Property |
Experimental |
Calculated |
|---|---|---|
Unit cell dimensions a,b (Å): |
3.250 |
3.295 |
Unit cell dimensions a (Å): |
5.207 |
5.285 |
Space group: |
\(P6_3mc\) |
|
Optical permittivity xx,yy: |
5.09 |
|
Optical permittivity zz: |
6.00 |
|
Static permittivity xx, yy: |
10.83 |
|
Static permittivity zz: |
11.67 |
|
TO phonons |
Frequency (|cm-1|) |
Intensity (D2Å-2amu-1) |
A |
350.0 |
17.1 |
E |
372.1 |
16.4 |
LO phonons |
||
A (001): |
502.0 |
|
E (010): |
511.2 |

Fig. 24 ZnO: Effect of shape on absorption
For the Maxwell-Garnett mixing rule the sphere morphology results in the two absorption peaks shifting from their TO positions to a higher wavenumber by about 80 cm-1. The plate morphology results in one of the peaks moving to higher wavenumber by about 130 cm-1, whilst the other remains at the TO position. The Maxwell-Garnett results are in close accord with some experimental results by Yamamoto et al [62] who measured the infrared spectrum of ZnO smoke particles and observed peaks in the absorption at 380, 530 and 550 cm-1. Previous work [63, 64] has also used effective medium theory to explain the observed spectrum. The data for this calculation can be found by looking in the Examples section of the installation guide under the Vasp/ZnO/application_note example.
Calcite using GULP
Calcite is the most stable polymorph of calcium carbonate and the crystal structure belongs to the \(R\overline{3}c\) space group. The force field and atomic structures used here are described in detail in the work by Fisler [65]. Briefly, the oxygen ions are described using a core-shell model [66]. The carbon - oxygen potential of the carbonate is taken to be a Morse potential and an additional 3 atom potential is used to maintain the O-C-O angle at 120o. The van der Waals interactions between non-bonded atoms are taken to be Buckingham potentials and the charges on the calcium, carbon and oxygen ions are +2, +1.3435 and -1.1145 respectively. The shell charge of the oxygen ion is -2.133 and the spring constant for the core-shell interaction is 52.74 eV/Å2. The unit cell was optimised using the primitive unit cell and the full space group symmetry. The calculation of the phonon spectrum was performed without symmetry but still using the primitive cell of the lattice. A summary of the calculated properties is given in Table 11. The data for this calculation can be found by looking in the Examples section of the installation guide under the Gulp/calcite example.
Property |
Experimental |
Calculated |
|---|---|---|
Unit cell dimensions a,b,c (Å): |
6.375 |
6.376 |
Unit cell angles: |
46.1 |
46.1 |
Space group: |
\(R\overline{3}c\) |
|
Optical permittivity xx,yy: |
1.91 |
|
Optical permittivity zz: |
2.00 |
|
Static permittivity xx, yy: |
6.70 |
|
Static permittivity zz: |
7.10 |
|
TO phonons |
Frequency (cm-1) |
Intensity (D2Å-2amu-1) |
E: |
114.8 |
2.39 |
A: |
127.4 |
3.36 |
A: |
249.3 |
1.23 |
E: |
320.7 |
5.82 |
A: |
338.1 |
4.14 |
E: |
620.1 |
3.38 |
A: |
732.0 |
26.89 |
E: |
1463.6 |
16.97 |
Fig. 25 shows the resultant spectra after postprocessing with PDielec. The damping parameter used in the calculation was a value of 5 cm-1. A 10% volume fraction was used with sphere and plate morphologies for the particles. The unique axis for the plate was taken to be the normal to the (211) surfaces in the primitive cell axes (or the (104) surfaces in the standard unit cell). Such surfaces define the rhombohedral faces commonly seen in calcite crystals [67]. Fig. 25 shows that the doubly degenerate TO absorption peak at 620 cm-1 is not significantly affected by spherical particles and there is a small shift to higher frequencies in the case of plate-like particles. The non-degenerate TO transition at 732 cm-1, which corresponds to the motion of the carbon atom of the carbonate along the unique direction of the slab, shows a shift to 786 and 819 cm-1 for the sphere and plate respectively. The doubly degenerate peak at 1463 cm-1 is shifted to 1480 cm-1 by spherical particles and is split by plate-like particles with one component which shifts to 1491 cm-1 . The data for this calculation can be found by looking in the Examples section of the installation guide under the Gulp/calcite example.

Fig. 25 Calculated Maxwell-Garnett absorption spectrum of 10% volume fraction of calcite in PTFE
Fluorapatite using VASP
The line shapes of the infrared absorption of apatite and fluorapatite were examined extensively by Balan et al [32]. Their calculations included the effect of crystallite habit on the spectrum and the results reported here are similar to their conclusions. The method used by Balan et al. is an infinitely dilute Maxwell-Garnett model, so the only difference between the methods used by them and those reported here using PDielec are the incorporation of the volume fraction into the theory and the use of an ellipsoidal shape for comparison with the other shapes.
All calculations were performed by VASP [1] using projector augmented-wave PAW [59] pseudo-potentials, the PBE [60] density functional, an energy cutoff of 600 eV and a k-point resolution of approximately 0.1 Å-1. Table 12 summarises the results of the calculations. Only the 3 highest frequency bands are reported and discussed. The TO intensity of the highest frequency band at 1038 cm-1 is low and will not be discussed further. The Bravais Friedel Donnay Harker (BFDH) [68] crystal habit of the optimised crystal is shown in Fig. 26. The habit was calculated using the Mercury software package. [69]. The BFDH crystal habit is often used to give an idea of the likely important faces of a crystal. It uses only the crystal lattice and space group to determine the crystal morphology. Fig. 26 shows that the {100} surfaces form a tube which are capped by the {011} surfaces. The effect of different particle shapes on the predicted spectrum is shown in Fig. 27. The calculations of the spectra were performed with a damping parameter (σ) of 2 cm-1. The ellipsoid was chosen to have an aspect ratio, a/b, of 2 and a principle axis along [001], which was compatible with the morphology predicted by the BDFH method. The two TO absorption frequencies at 981 and 986 cm-1 have A and E symmetry respectively. Spherical crystallites result in three absorption peaks at around 1000, 1010 and 1015 cm-1. Needle shaped crystallites leave the A symmetry TO absorption peak at 981 cm-1 unaffected but shift and split the E symmetry TO peak to 1020 and 1046 cm-1. A plate morphology with (100) surfaces results in the A and one component of the E TO absorption peak remaining at the TO frequencies, with the other component of the E shifting 85 cm-1 to 1075 cm-1. The ellipsoidal morphology shows three shifted peaks at 1000, 1018 and 1045 cm-1. These results are consistent with those of Balan et al. [32], who gave detailed results for hydroxyapatite. The data for this calculation can be found by looking in the Examples section of the installation guide under the Castep/F-Apatite example.
Property |
Experimental [70] |
Calculated |
|---|---|---|
Unit cell dimensions a,b (Å): |
9.417 |
9.447 |
Unit cell dimensions c (Å): |
6.875 |
6.926 |
Space group: |
:math:P6_3m` |
|
Optical permittivity xx,yy: |
2.891 |
|
Optical permittivity zz: |
2.894 |
|
Static permittivity xx,yy: |
12.081 |
|
Static permittivity zz: |
8.841 |
|
TO phonons |
Frequency (cm-1) |
Intensity (D2Å-2amu-1) |
A: |
981.8 |
112.6 |
E: |
986.3 |
101.0 |
E: |
1038.1 |
7.92 |

Fig. 26 BFDH Morphology of fluorapatite

Fig. 27 Calculated Maxwell-Garnett absorption spectra of 10% fluorapatite in PTFE
L-aspartic Acid using CASTEP
L-aspartic acid is a zwitterion in the solid state so the shape of the particles used in the measurement of IR and THz spectra may be important. The starting geometry for optimisation of the unit cell and molecular structure of L-aspartic acid was taken from Derissen et al [71]. The PBE [60] functional was used with a plane wave energy cutoff of 1000 eV and norm-conserving pseudo-potentials. A dispersion correction using the Tkatchenko-Scheffler scheme [72] available in CASTEP was applied for both the geometry optimisation and the calculation of the phonon spectrum at the gamma point, with an S6 scaling factor [73] of 1.0. A summary of the results of the calculations is shown in Table 13.
Property |
Experimental [71] |
Calculated |
|---|---|---|
Unit cell dimensions a (Å): |
7.617 |
7.597 |
Unit cell dimensions b (Å): |
6.982 |
7.028 |
Unit cell dimensions c (Å): |
5.142 |
5.113 |
Unit cell angle \(\beta\): |
99.84 |
98.77 |
Space group: |
\(P2_1\) |
|
Optical permittivity xx: |
2.68 |
|
Optical permittivity yy: |
2.20 |
|
Optical permittivity zz: |
2.56 |
|
Static permittivity xx: |
4.58 |
|
Static permittivity yy: |
3.65 |
|
Static permittivity zz: |
3.65 |
|
TO phonons |
Frequency (cm-1) | Intensity (D2Å-2amu-1) |
|
84.5 |
0.120 |
|
104.7 |
0.202 |
|
106.0 |
0.243 |
|
115.3 |
0.474 |
|
137.3 |
0.617 |
|
1290.0 |
55.0 |
|
2945.9 |
102.8 |
|
2947.3 |
48.2 |
|
3053.7 |
44.1 |
|
The THz spectrum of L-aspartic acid has been reported by Juliano and Korter [73] in the frequency range 0-90 cm-1. The infrared spectrum has been reported and assigned by Lopez et al [74]. Fig. 28, Fig. 29 and Fig. 30 show the calculated absorption spectra for L-aspartic acid for three frequency ranges. The calculation of the spectra used the Maxwell-Garnett mixing rule with a 10% volume fraction of L-aspartic acid in PTFE and for comparison the TO mixing rule. A damping factor of 2 cm-1 was used. Spherical and a variety of plate-like inclusions were used to illustrate their effect on the absorption spectra. Fig. 28 shows the frequency range from 60-130 cm-1 which is that covered by THz spectroscopy. The shifts observed for the different particle morphologies are not large, but the change in intensities is significant. The molecular motions associated with phonons at these frequencies tend to be whole molecule motion involving rotation. Fig. 29 shows the frequency range from 1260-1340 cm-1. In this frequency range bending of the carboxylate anion contributes to the spectrum significantly. The three different plate morphologies show different and significant shifts in the TO absorption peak at 1290 cm-1. The spherical morphology shows a shift of around 25 cm-1 to higher wavenumber. Fig. 30 shows the spectrum in the frequency range 2900-3100 cm-1, which corresponds to the motion of O-H (below 2980 cm-1) and N-H (above 2980 cm-1) stretching. The effect of the different possible crystal morphologies is large with shifts to higher frequency of up to 50 cm-1. The spectrum below 3000 cm-1 arises from two TO absorptions at 2946 and 2947 cm-1. Because the motions associated with each mode interact differently with the internal field within each crystal they give rise to different shifts producing more complex spectra. The data for this calculation can be found by looking in the Examples section of the installation guide under the Castep/AsparticAcid example.

Fig. 28 Aspartic Acid: Frequency range 60-130 cm-1

Fig. 29 Aspartic Acid: Frequency range 1260-1340 cm-1

Fig. 30 Aspartic Acid: Frequency range 2900-3100 cm-1
MgO Example using Mie Scattering
Fig. 31 compares a Mie scattering calculation with the results from Maxwell-Garnett effective medium theory. The same data set was used for the CASTEP, MgO example. A volume fraction of 1% was used with a small sphere radius (0.1 μm) and a broadening of 5 cm-1 embedded in a matrix of PTFE. A power expansion in the size parameter of the Mie expressions indicates that for small sizes of particles, the Mie and the Maxwell-Garnett methods should be the same. This is verified in Figure. The data for this calculation can be found by looking in the Examples section of the installation guide under the Mie/MgO example.

Fig. 31 Comparison of Mie and Maxwell methods. 1% volume fraction of MgO in PTFE, sphere radius of 0.1 μm and a broadening of 5 cm-1
To better understand what makes particles large or small Table 14 shows the dimensionless size parameter, \(x\), as a function of wavenumber and of sphere radius. It has been assumed that the supporting medium is PTFE. Since the power expansion of the size parameters leads to terms that are quadratic in \(x\), it should be expected that when \(x\) is less than about 0.1 μm, the particles can be considered small. It can be seen that particles less than 0.01 μm are small over the range of frequencies considered. But while 0.1 μm particles are small in the THz regime, and low-frequency infrared, they should not be considered small over the more extended infrared frequencies. 1μm particles should be considered large for both the THz and the extended infrared.
Wavenumber (cm-1) |
Radius of sphere (μm) |
||||
|---|---|---|---|---|---|
0.001 |
0.01 |
0.1 |
1 |
10 |
|
100 |
0.0009 |
0.0089 |
0.0888 |
0.8884 |
8.8841 |
200 |
0.0018 |
0.0178 |
0.1777 |
1.7768 |
17.7682 |
300 |
0.0027 |
0.0267 |
0.2665 |
2.6652 |
26.6523 |
400 |
0.0036 |
0.0355 |
0.3554 |
3.5536 |
35.5364 |
500 |
0.0044 |
0.0444 |
0.4442 |
4.4420 |
44.4204 |
600 |
0.0053 |
0.0533 |
0.5330 |
5.3305 |
53.3045 |
700 |
0.0062 |
0.0622 |
0.6219 |
6.2189 |
62.1886 |
800 |
0.0071 |
0.0711 |
0.7107 |
7.1073 |
71.0727 |
900 |
0.0080 |
0.0800 |
0.7996 |
7.9957 |
79.9568 |
1000 |
0.0089 |
0.0888 |
0.8884 |
8.8841 |
88.8409 |
Fig. 32 shows how the Mie predictions change as the particle radius changes from 0.2 to 1.6 μm. As the particle size increases the peak above 500 cm-1 splits into two. One broader peak moves to a lower frequency as the particle size increases and the peak at about 550 cm-1 loses intensity as the particle size increases. There is also the onset of absorption at 388 cm-1 which corresponds to the bulk TO modes.

Fig. 32 Variation in absorption calculated by the Mie method for different radii of spheres. 1% volume fraction of MgO in PTFE and a broadening of 5 cm-1
Fig. 33 shows the effect of increasing the particle size further. More structure appears in the absorption, with increasing absorption around the bulk TO frequency. Above 4.0 μm there is more low frequency structure appearing, below 300 cm-1. The data for this calculation can be found by looking in the Examples section of the installation guide under the Mie/MgO example.

Fig. 33 Variation in absorption calculated by the Mie method for larger sphere radii. 1% volume fraction of MgO in PTFE and a broadening of 5 cm-1
ZnO Example using Mie Scattering
ZnO is an anisotropic material, so the treatment described here using Mie scattering is an approximation. However, the permittivity constant tensor is diagonal due to the space group symmetry of the crystal.

Fig. 34 ZnO spheres in PTFE using Maxwell Garnett

Fig. 35 ZnO spheres using Mie
Figures Fig. 34 and Fig. 35 compare the capabilities of the Maxwell-Garnett and Mie methods for describing volume fraction effects. Fig. 34 shows that Maxwell-Garnett predicts a lowering of intensity and frequency of the high-frequency peak as the volume fraction is increased. Fig. 35 illustrates that Mie theory shows no effect of the change in volume fraction. This is to be expected as the theory assumes that each sphere is isolated and does not affect the other spheres around it. It should be pointed out that the figures are plotting molar absorption coefficients. The actual absorption would increase with volume fraction of ZnO.
Fig. 36 shows that the variation of the Mie scattering with sphere radius follows a similar pattern to that observed in MgO, though slightly more complex. The initial peaks at about 440 and 460 cm-1 broaden and shift to lower frequencies as the particle size increases. Bulk bands around 350 and 372 cm-1 can be seen which grow in intensity and shift to lower frequencies as the particle size increases. The data for this calculation can be found by looking in the Examples section of the installation guide under the Vasp/ZnO/application_note_mie example.

Fig. 36 ZnO spheres using Mie Mie scattering of 10% volume fraction ZnO spheres in PTFE using a line broadening factor of 5 cm-1.
Fitting the ATR Spectrum of Na2(SO4)2
To calculate the expected Attenuated Total Reflectance spectrum of Na2(SO4)2 a VASP calculation was performed of the optimised structure followed by the dynamical matrix and the phonon spectrum at the \(\Gamma\) point. After reading in the OUTCAR with PDGui, the scenario tab is modified to reflect the materials used in an ATR experiment. The support matrix is set to air and the volume fraction of the dielectric is set 80%. This value needs to be chosen to reflect the particle shape and size distribution. When looking at the plot with the plotting tab, ensure that the ‘Powder ATR’ plot type is used. This ensures that the fitter tab uses that plot for the fitting. For the case of non-polarised radiation the choice of 0.5 for the ‘ATR S polarisation fraction’ is appropriate. The settings tab will look like the tab shown below.

Fig. 37 Na2(SO4)2 Scenario Tab for an ATR scenario
The initial fitter tab will look something like what is shown below. A file has been specified holding the experimental ATR spectrum. There is a list of Lorentzian widths for each phonon transition. The Replot button re-plots the graph after any changes to the sigma widths of the transition. Changes to the phonon transition widths made in the Fitter Tab are reflected in the Settings tab.
If changes are made to the widths a re-plot will cause all the information needed (crystal permittivity and powder permittivity) to be recalculated. The progress of the calculation is shown below the three buttons. After a recalculation four items of data are show;
- X-correlation
- This is the maximum in the cross-correlation function calculated between the experimental and simulated spectrum.A value of 1.0 means that there is perfect agreement between the shapes of the calculated and experimental curves, a value of 0.0 indicates that they are not correlated at all.
- frequency scale
- This shows the frequency scaling factor being used to scale the calculated frequency. This can be set using the Settings at the top of the Fitter tab. It is usually 1.0, but where a DFT method is known to show systematic errors in its calculated frequencies, it is possible to compensate for these using this value.
- shift
- This is the frequency at which the cross correlation function is a maximum, it is sometimes called the ‘lag’. By default the plot is shown without the frequency shift, but this can be changed by using the Replot with frequency shift button.
- rmse
- This is the root mean squared difference between the experimental and calculated spectra. If the units of the two spectra are different then this is not a very useful measure of their similarity and any fitting should be done using the maximum in the cross-correlation function.
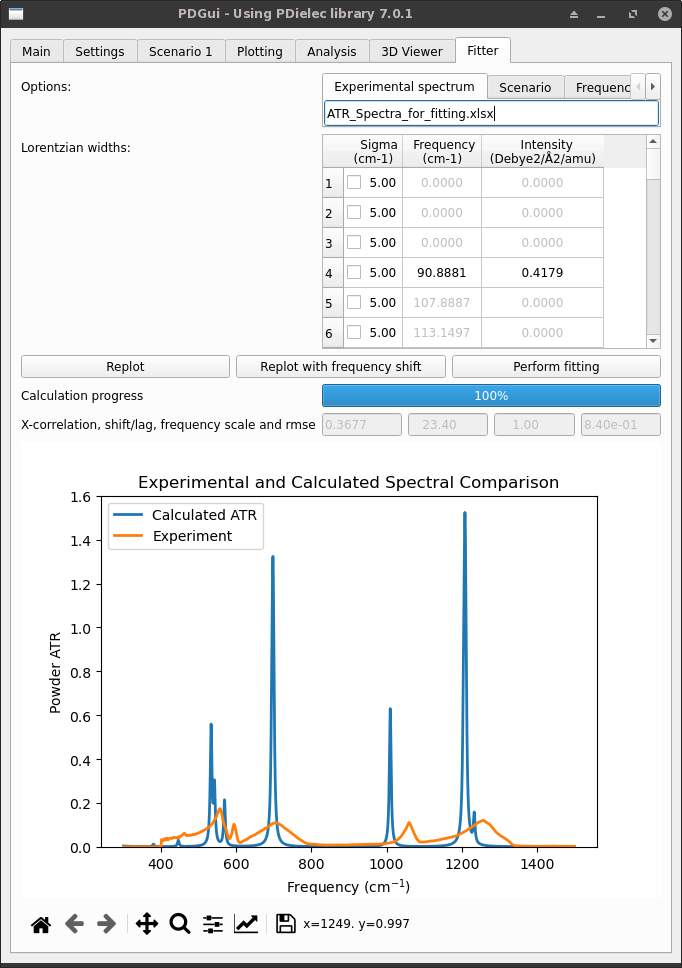
Fig. 38 Na2(SO4)2 Fitter Tab for fitting ATR spectra
In the situation above the calculated and experimental spectra have been plotted on the same scale, but very often the units used for absorption are confusing and if necessary a separate scale for the experimental and calculated spectra can be used by toggling ‘Independent y-axes’ on the Fitter settings tab.
Visual inspection of the spectra above indicates that the transition widths are too narrow and need broadening. This is simply achieved by choosing a frequency range and editing the sigma values. Around 1200 cm-1 there are two transitions with similar intensities. The values of both sigmas should be modified until the calculated peak height is similar to the experimental one. Where possible the same values of sigma should be used for several transitions and this process repeated for the important frequency ranges. The table below shows the changes that can be made to improve the fit.
Mode |
Frequency (cm-1) |
Starting sigma |
Final sigma |
|---|---|---|---|
21 |
445.2 |
5 |
10 |
22 |
528.1 |
5 |
200 |
24 |
532.4 |
5 |
10 |
28 |
663.9 |
5 |
100 |
31 |
1000.9 |
5 |
35 |
33 |
1189.0 |
5 |
130 |
35 |
120.6 |
5 |
100 |
The cross-correlation of this fit is 0.7369 at a frequency shift of 21.20 cm-1. The plot below shows the comparison of the calculated and experimental curves and the plot was made incorporating the frequency shift. It is possible to further improve the quality of the agreement of the fit by selecting some of the sigmas for optimisation using the tick box next to each frequency and clicking on the ‘Perform fitting’ button. If the ‘Optimise scaling’ option is selected in the Settings tab, then very often the value of the shift parameter is reduced considerably. The problem with doing the fitting automatically is that maximising the correlation function may not lead to comparisons that ‘look’ as good as simply making sure the peak heights of the experimental and calculated spectra are similar. The data for this calculation can be found by looking in the Examples section of the installation guide under the ATR/Na2SO42_fit example.
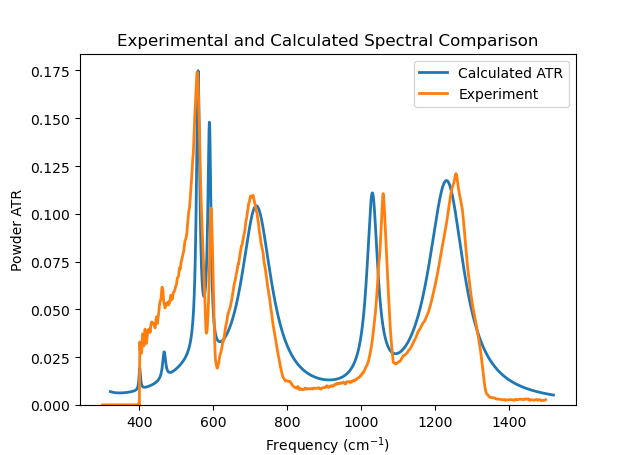
Fig. 39 Na2(SO4)2 Fitted Spectra